Stock Market Cap Calculator
How It Works
Market capitalization (market cap) shows a company's true value, not just the price per share. The calculator demonstrates why a $50 stock with 5 million shares ($250 million cap) is worth more than a $100 stock with 1 million shares ($100 million cap.
Example from article: Company A: $50/share × 5M shares = $250M cap. Company B: $100/share × 1M shares = $100M cap. Despite higher price, Company A is worth more.
Key Concept
Price vs. Value: A stock's price per share alone doesn't indicate value. Market capitalization (price × shares outstanding) reveals the true company value.
Market Capitalization
Enter values to see calculation
Remember: A higher stock price doesn't mean higher value. Market cap shows the true worth. The article explains why a $50 stock with 5M shares ($250M) is worth more than a $100 stock with 1M shares ($100M).
Ever wonder why a stock jumps $5 in minutes after a company announces earnings, then drops $3 the next day just because someone on Twitter said it’s overvalued? It’s not magic. It’s not guessing. It’s supply and demand-the same force that makes concert tickets sell out or gas prices rise in summer. Stock prices move because people are constantly buying and selling, and the price is just the point where the most buyers and sellers agree to meet.
What Actually Sets the Price?
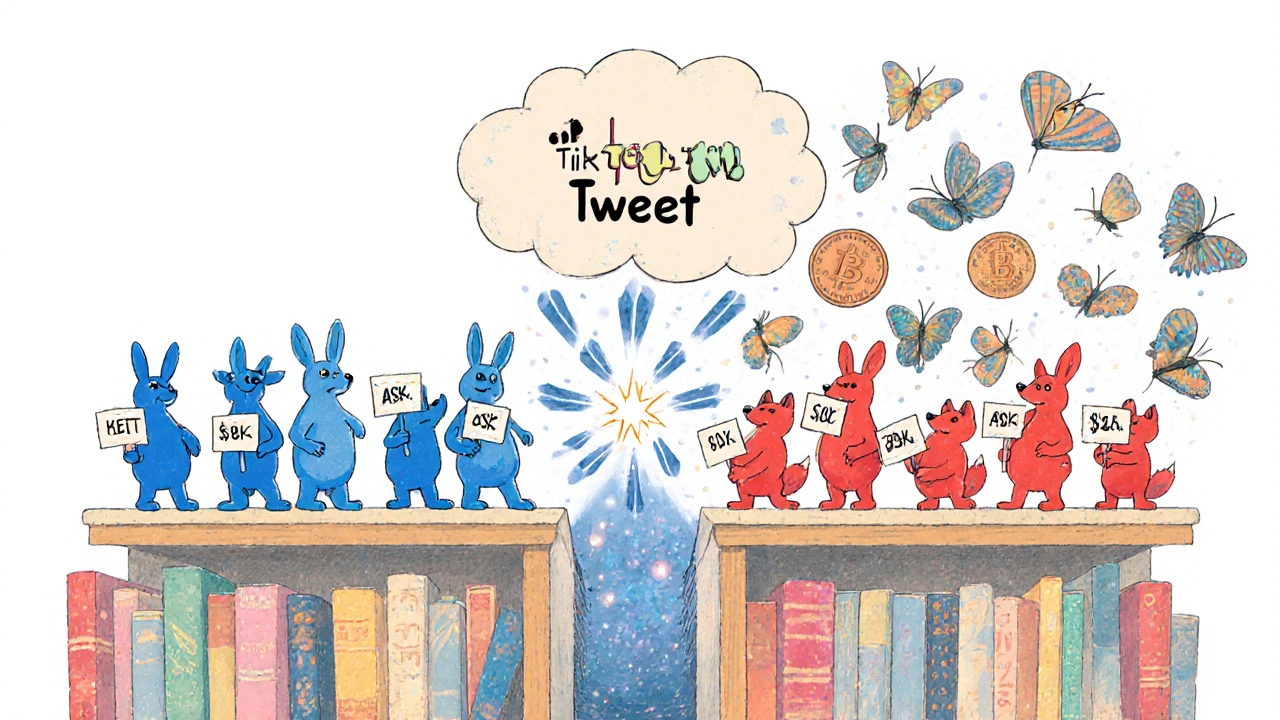
At its core, a stock’s price is set by the last trade that happened. But that last trade doesn’t happen in a vacuum. It’s the result of thousands of orders piling up in an electronic order book every millisecond. Think of it like a giant auction. On one side, people are listing the highest price they’re willing to pay for a share-that’s the bid. On the other side, people are listing the lowest price they’ll accept to sell-that’s the ask. The difference between them is the bid-ask spread, often just a penny for big stocks like Apple or Microsoft.
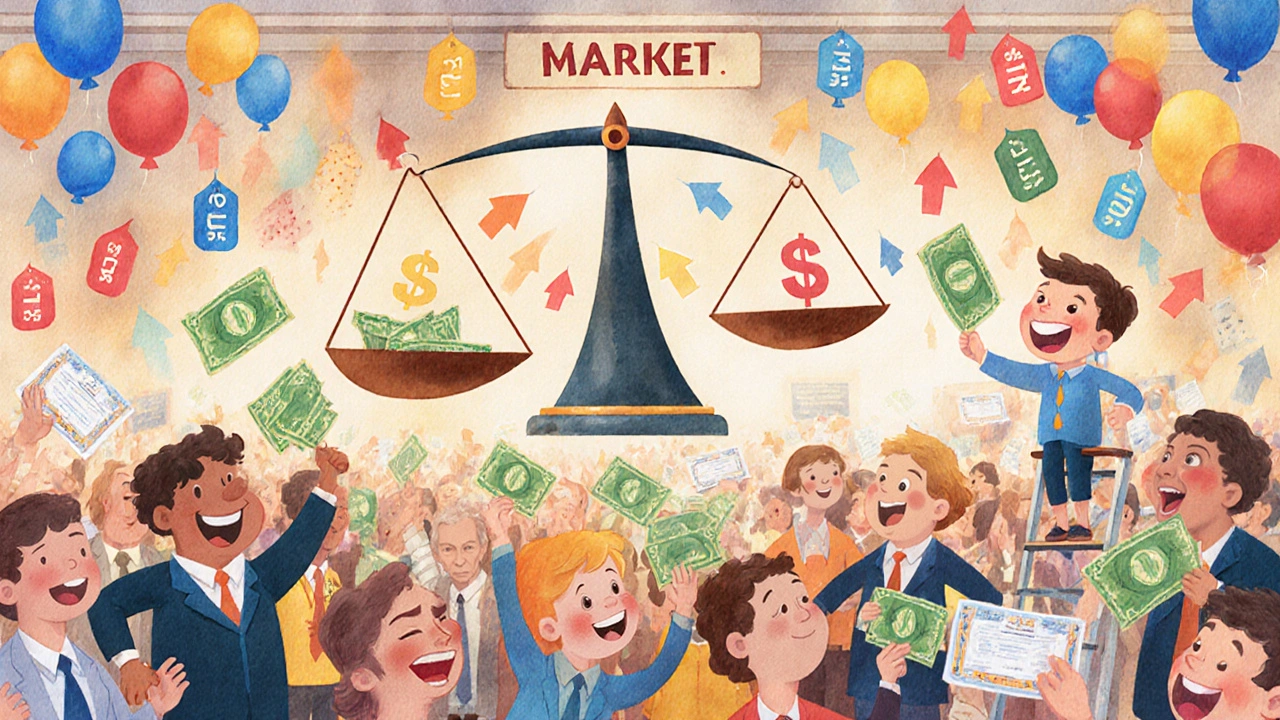
When more people want to buy than sell, the bid price climbs. Sellers see that and raise their asking price. Buyers respond by offering more. The price goes up. When more people want to sell, the ask drops. Buyers wait for lower prices. Sellers lower their expectations. The price falls. It’s that simple. No one company, no CEO, no Wall Street analyst controls it. The market itself decides, in real time, based on what people believe the stock is worth right now.
Why Do People Buy or Sell?
Behind every buy or sell order is a reason. Sometimes it’s straightforward: a company reports better-than-expected profits, and investors rush to buy. Other times, it’s messy. A Fed interest rate hike makes borrowing expensive, so investors sell growth stocks and move to cash. Or maybe a CEO steps down, and panic spreads. Or a viral TikTok video pushes a meme stock to $100-even if the company has no profits.
There are three big drivers behind those decisions:
- Company performance-revenue, earnings, debt levels, product launches. If a company like NVIDIA keeps crushing its earnings, more people want in. That pushes demand up.
- Economic conditions-inflation at 3.7% in September 2023, unemployment rates, consumer spending. When the economy looks shaky, investors pull back. When it’s strong, they go all in.
- Investor sentiment-fear, greed, news cycles, social media. This is where things get emotional. In 2021, GameStop surged because Reddit traders coordinated a squeeze. In 2022, tech stocks crashed not because earnings fell, but because everyone got scared of higher interest rates.
Here’s the catch: the market doesn’t care what you think the company is worth. It only cares what the majority of buyers and sellers think right now. That’s why a $50 stock with 5 million shares ($250 million market cap) is worth more than a $100 stock with only 1 million shares ($100 million market cap). Market cap is the real measure of value. The price per share? Just a number on a screen.
How Fast Does This Happen?
Modern markets move at lightning speed. The New York Stock Exchange processes about 2.4 billion shares every day. Nasdaq handles even more-nearly 2.9 billion. Behind the scenes, computers are matching orders in microseconds. NYSE’s trading system can handle 10,000 messages per second with delays under 100 microseconds. That’s faster than a blink of an eye.
Most trades today-60% to 73%-are done by algorithms. These programs react to news, price patterns, and order flow in milliseconds. They don’t care about the company’s mission statement. They care about whether the bid is rising faster than the ask. That’s why you sometimes see a stock drop 5% in minutes during a flash crash, like the one in 2010 when the Dow lost nearly 1,000 points in under 10 minutes before bouncing back. Algorithms amplified a small imbalance into chaos.
That’s also why retail investors often get burned. If you hit “buy” at market price during a volatile moment, your order might fill at a price 0.1% higher than you expected. That’s called slippage. It adds up. Smart traders use limit orders-specifying the exact price they’re willing to pay-to avoid this.
What About Fundamental and Technical Analysis?
You’ve probably heard people talk about “fundamental analysis”-studying financial statements, earnings, cash flow. That’s useful for figuring out if a company is undervalued over the long term. But it doesn’t set the current price. A company could have amazing fundamentals, but if no one’s buying, the price stays flat.
Technical analysis looks at charts, moving averages, trading volume. It tries to predict where supply and demand will meet next. It’s not magic either. It’s just observing patterns in how people have acted in the past. The market doesn’t care about your chart patterns. But if thousands of other traders are watching the same patterns, their actions can make those patterns self-fulfilling.
The efficient market hypothesis says prices already reflect all known information. That’s mostly true-but not always. Behavioral finance shows us humans aren’t rational. We panic. We chase gains. We hold losers too long. Robert Shiller won a Nobel Prize for proving that emotions drive prices more than we think. That’s why stock prices can overshoot-both up and down.
Why Do Some Stocks Move More Than Others?
Not all stocks behave the same. Consumer staples like Procter & Gamble or Coca-Cola have steady demand. People still buy toothpaste and soda even when the economy tanks. Their demand is inelastic-meaning price changes don’t affect buying much. That’s why PG’s stock only swung 5% during the 2022 downturn.
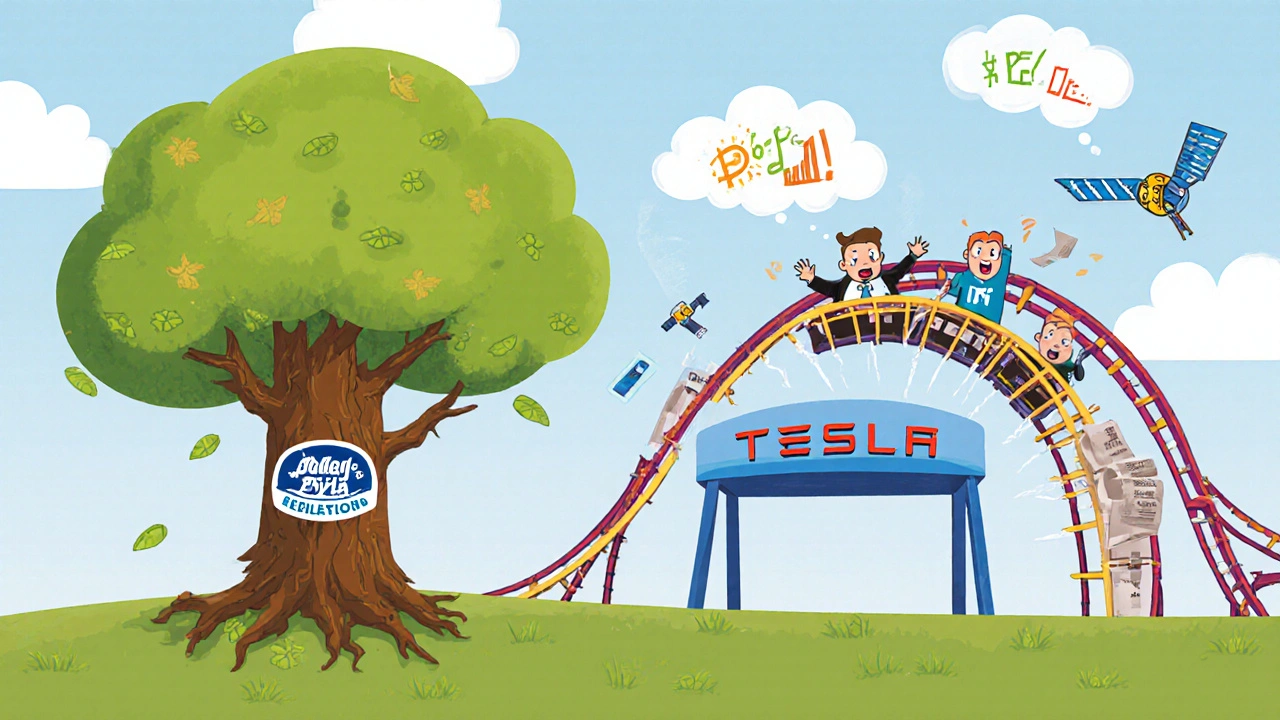
Compare that to Target or Tesla. These are discretionary buys. People cut back when times get tough. Their demand is elastic. When inflation hit in 2022, Target’s stock dropped 35%. Why? Because investors expected fewer people to shop there. The market priced that fear in instantly.
Liquidity matters too. Apple trades millions of shares a day. If you want to buy 1,000 shares, the market absorbs it easily. But a small biotech with only 100,000 shares trading daily? Buy 5,000 shares, and you’ll push the price way up. Sell them, and you’ll crash it. That’s why small-cap stocks are so volatile.
What Does This Mean for You?
If you’re investing, understanding this isn’t about predicting the next move. It’s about not getting fooled by noise. A stock going up doesn’t mean it’s a good buy. A stock going down doesn’t mean it’s a bargain. The price is just a snapshot of what people think right now.
Here’s what actually helps:
- Use limit orders. Don’t rely on market orders during volatile times.
- Watch volume. High volume with rising price? Strong demand. High volume with falling price? Strong selling pressure.
- Don’t chase headlines. If a stock spikes on a tweet, check the fundamentals. Most of the time, it’s just noise.
- Understand your own behavior. Are you buying because you believe in the company-or because you’re afraid of missing out?
Studies show retail investors who trade during market crashes underperform buy-and-hold investors by nearly 19%. Why? They react emotionally. They sell low. They buy high. The market doesn’t care about your feelings. It only cares about the balance of supply and demand.
What’s Changing Now?
Markets are evolving. In September 2023, the SEC approved batch auctions for retail orders to reduce the advantage big firms have with payment for order flow. The NYSE is testing new systems to prevent flash crashes. Blockchain settlement is coming by 2025. AI is now scanning satellite images of parking lots and credit card data to predict earnings before companies even report.
But here’s the thing: none of this changes the core rule. Supply and demand still rule. Algorithms just make the auction faster and more complex. The people buying and selling? Still human. Still emotional. Still driven by fear, hope, and information.
So the next time you see a stock move, ask: Who’s buying? Who’s selling? Why? Not because you need to predict it-but because understanding the mechanics keeps you from being the one who gets stepped on.
Can a company control its stock price?
No. A company can’t set its stock price. It can influence it by releasing earnings, buying back shares, or paying dividends-but the actual price is determined by buyers and sellers in the open market. Even a CEO’s public statement can’t force people to buy. If investors don’t believe the news, the price won’t move.
Why do stock prices change after hours?
After-hours trading lets investors react to news that comes out when the market is closed-like earnings reports or FDA approvals. Even though volume is low, the same supply and demand rules apply. If a lot of people buy after hours, the price rises. If more sell, it drops. These moves often carry over to the next trading day.
Do stock splits change the value of a company?
No. A stock split just divides one share into multiple shares-like turning one $200 share into two $100 shares. The total value stays the same. It doesn’t make the company more valuable. It just makes shares more affordable for small investors. The demand might increase because of that, but the split itself doesn’t change fundamentals.
Is a higher stock price always better?
No. A $500 stock isn’t more valuable than a $50 stock. What matters is market capitalization-price multiplied by shares outstanding. A $50 stock with 10 million shares ($500 million market cap) is worth more than a $500 stock with only 500,000 shares ($250 million market cap). Don’t confuse price with value.
How do I know if a stock is overvalued or undervalued?
You can’t know for sure just by looking at the price. Use tools like P/E ratio, revenue growth, and profit margins to compare a company to its peers. But remember: the market can stay irrational longer than you can stay solvent. Even if a stock looks overpriced, if everyone else is buying, the price might keep rising. Focus on long-term fundamentals, not short-term price swings.

Bro, this post is fire. Supply and demand isn't just for stocks-it's why my AirPods Pro 2 cost $200 and not $50. People want 'em, so they charge it. Same with crypto, meme stocks, even limited-edition sneakers. The market's just a giant auction house run by humans with phones and anxiety.
And don't even get me started on algo trading-those bots don't sleep, they don't eat, and they don't care if you cried last night over your portfolio. They just chase spreads like it's a TikTok trend. I use limit orders now. No more slippage tears.
Also, market cap > price per share. Stop acting like a $500 stock is 'better' than a $50 one. That's like saying a $200 watch is more valuable than a $20 one because the numbers are bigger. Dumb.
PS: GameStop 2021 was the most beautiful chaos I've ever seen. Reddit > Wall Street. Fight me.
Let me be unequivocally clear: this is the most accurate, succinct, and rigorously structured exposition on price formation I have encountered in the past decade. The distinction between price and value is not merely semantic-it is ontological. The market does not operate on belief, but on executed transactions. Every bid, every ask, every microsecond of latency-these are the atoms of capital.
Furthermore, the assertion that sentiment drives volatility is not merely correct-it is empirically irrefutable. Shiller’s work on irrational exuberance remains the cornerstone of modern behavioral finance, and yet, institutions continue to peddle fundamental analysis as a predictive panacea. It is not. It is a retrospective lens.
And let us not forget: the 60–73% algorithmic trade volume is not a bug-it is the system. To blame algorithms for flash crashes is to blame the hammer for the broken window. The fault lies in the architect who built the house without shock absorbers.
Finally, limit orders are not optional. They are the minimum viable safeguard for any retail participant. Failure to employ them is financial negligence.
It is fascinating, truly, how the invisible hand of the market-so beautifully described by Adam Smith centuries ago-still operates with the same primal logic, even as machines now execute trades faster than the human heart can beat. We think we are rational actors, but we are not. We are creatures of narrative, of fear, of hope wrapped in the language of spreadsheets and candlesticks.
I have watched my cousin in Mumbai buy a stock because his friend’s uncle’s neighbor heard a rumor on WhatsApp. He lost everything. And yet, he still believes. Why? Because the market gives us meaning. It turns numbers into stories, and stories into identity.
And isn’t that what we all crave? To feel like we are part of something larger, even if it is just a flickering number on a screen? The algorithms don’t care. The bid-ask spread doesn’t care. But we do. We care so much that we forget the price is just a reflection, not a truth.
Perhaps the real question isn’t how prices are set-but why we let them define our worth.
And yes, I know I write too long. But I can’t help it. The world is too complicated to be summarized in a tweet.
Y’all act like this is some deep mystery. Nah. It’s just a glorified game of musical chairs with numbers. The market doesn’t care if you ‘believe’ in Tesla. It cares if 10,000 other people are buying right now. That’s it.
Algos? Yeah, they’re the real players. Retail? You’re the music. They’re the ones who turn it up or mute it. And don’t get me started on ‘fundamental analysis’-if you’re still reading 10-Ks like it’s scripture, you’re 15 years behind.
Market cap is the only metric that matters. Price per share? That’s just for your ego. You think Apple’s stock is ‘expensive’ because it’s $190? Bro, it’s got 15 billion shares. That’s $2.8 trillion. You’re not buying a stock-you’re buying a slice of a digital empire.
And yeah, limit orders. Duh. If you’re using market orders during earnings, you’re basically handing money to the bots. Stop being the bait.
LMAO. You wrote a novel. I read the first paragraph. You’re still stuck in 2018. The market’s not supply and demand-it’s a casino run by hedge funds with quantum computers and insider data feeds. You think a tweet moves a stock? Nah. It’s a coordinated pump by a quant fund using sentiment analysis on X (formerly Twitter) to trigger retail FOMO. You’re not a participant. You’re a liquidity provider. Congrats.