Fee Impact Calculator
How Fees Impact Your Returns
Your investment fees can silently eat away at your returns. This calculator shows you how much you're losing to fees over time and how much you could save by switching to lower-cost options.
What You Should Do Next
Looking at the numbers? Here's what to do:
- Ask for a fee waterfall analysis - Get the exact breakdown of all fees you're paying.
- Compare to low-cost index funds - If your fee is above 0.25%, ask why you're paying more.
- Switch to lower-cost options - An ETF with a 0.08% expense ratio is worth the switch.
- Reinvest your savings - The $39,188 in savings above could grow to over $75,000 with annual returns.
Why Your Portfolio Is Drifting (And Why It Costs You Money)
Most people think their portfolio stays on track just because they didn’t touch it. That’s a dangerous assumption. Without regular checkups, your investments slowly drift away from your original plan. A portfolio that started with 60% stocks and 40% bonds might end up at 72% stocks and 28% bonds after a strong market year. That’s not investing-it’s gambling with your risk level.
According to Vanguard’s 2023 research, portfolios left unchecked for two years drift by an average of 10-15% from their target allocation. That means if you’re saving for retirement and planned to be conservative, you could be exposed to way more market risk than you ever intended. And when the market turns, you’re the one stuck holding the bag.
The fix? An annual portfolio checkup. Not a quick glance at your balance. Not a chat with your advisor about how things are “doing.” A real, structured review of your Investment Policy Statement (IPS), your fees, and your tax situation. Done right, this one process can add 0.8% to 1.2% in extra returns every year-money that stays in your pocket instead of going to brokers, fund managers, or the IRS.
Your Investment Policy Statement: The Only Document That Matters
Your IPS is your financial compass. It’s the only document that tells you when to buy, when to sell, and when to do nothing. And yet, only 43% of individual investors have one, according to Charles Schwab’s 2024 report. That’s shocking. If you don’t have a written IPS, you’re flying blind.
A proper IPS isn’t a vague goal like “grow my money.” It’s specific. It includes:
- Your exact return target (e.g., “6-8% annualized after inflation”)
- Your risk tolerance measured on a scale (like FinaMetrica’s 20-point test)
- Your time horizon (“I need this money in 18 years for retirement”)
- Your target asset allocation (e.g., 50% U.S. stocks, 20% international, 25% bonds, 5% cash)
- Your rebalancing rules (e.g., “Rebalance if any asset class moves more than 5% from target”)
- Your benchmark (e.g., “U.S. stock performance will be measured against the S&P 500”)
If your advisor doesn’t give you this document-or worse, says it’s “just a guideline”-find someone who takes investing seriously. The CFA Institute requires advisors to maintain an IPS for every client. If yours doesn’t, they’re cutting corners.
Review your IPS every year. Has your life changed? Did you get a promotion? Have you paid off your mortgage? Did your risk tolerance shift after a market crash? Update your IPS. Then stick to it. No emotional decisions. No chasing hot stocks. Your IPS is your anchor.
Fees Are Eating Your Returns (Here’s How to Find Them)
Fees are the silent killer of investment returns. You don’t see them deducted in real time. They’re buried in expense ratios, transaction costs, and hidden advisory charges. But they add up fast.
Let’s break it down:
- Advisory fees: If you’re paying 0.89% annually (the 2024 average for portfolios under $1 million), that’s $890 per year on a $100,000 portfolio.
- Expense ratios: Actively managed mutual funds average 0.45%. Index funds? Just 0.08%. That’s a 5.6x difference. Over 20 years, that gap can cost you over $50,000 in lost growth.
- Transaction costs: Every trade you make-buying or selling-costs around 0.15%. That’s not just the commission. It’s the bid-ask spread and market impact.
- Cash drag: If you’re holding too much cash (say, 10% when your IPS says 5%), you’re losing about 0.25-0.50% per year in potential returns.
Here’s what to do: Ask your advisor for a fee waterfall analysis. This isn’t a fancy term-it’s just a simple chart showing every dollar you’re paying, from top to bottom. Most advisors won’t offer it unless you ask. But 76% of savvy investors do. If they resist, that’s a red flag.
Look at your fund statements. Find the “expense ratio.” If it’s over 0.25% for a U.S. stock fund, ask why. Chances are, you’re paying for active management that doesn’t beat the index. Swap it for a low-cost ETF. You’ll thank yourself in 10 years.
Tax Optimization: The Hidden 1.2% Boost Most People Miss
Taxes are the one thing you can control that no one else can. Your advisor can’t pick the market. But you can pick which shares to sell-and when.
Let’s say you have $100,000 in gains across multiple accounts. If you sell everything at once, you could owe $20,000 in capital gains tax. But if you spread it out, use tax-loss harvesting, and place assets in the right accounts, you might pay $5,000-or nothing.
Here’s how to do it:
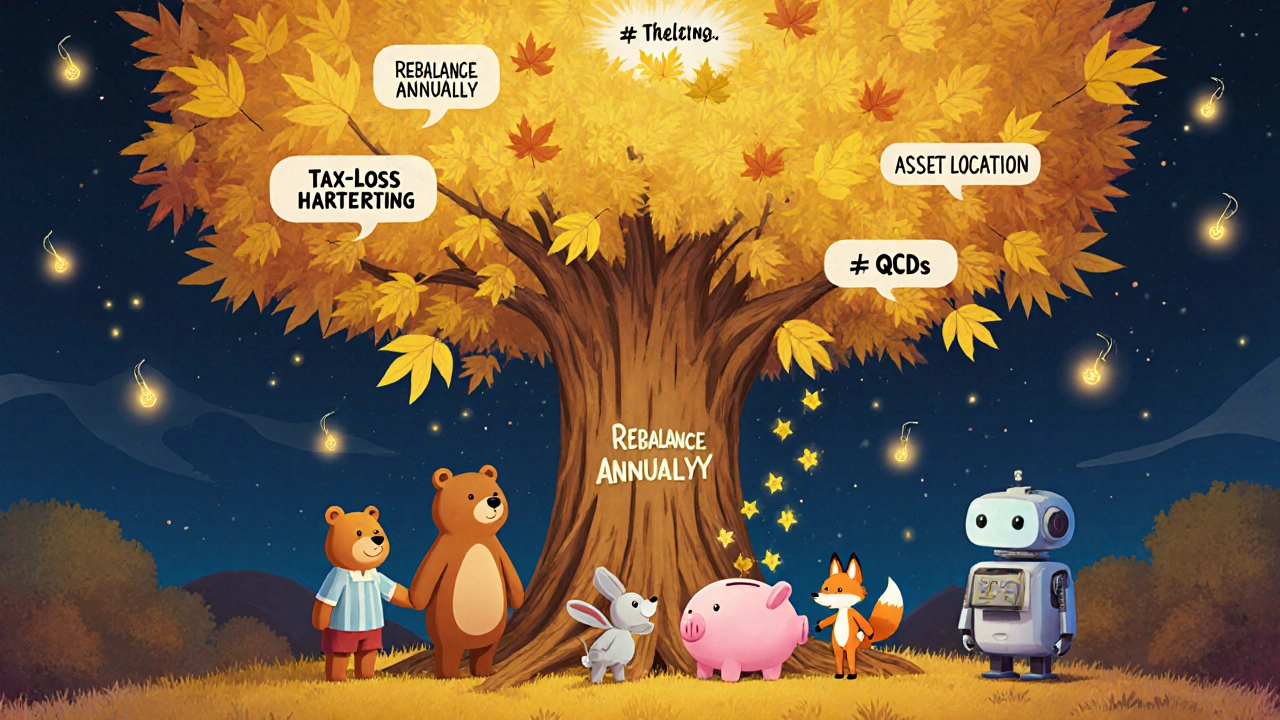
- Tax-loss harvesting: Sell losing investments to offset gains. You can deduct up to $3,000 in losses against your ordinary income each year. Any extra losses carry forward forever. But watch out for the wash sale rule: you can’t buy the same or “substantially identical” asset within 30 days.
- Asset location: Put tax-inefficient assets (like bonds or REITs) in tax-advantaged accounts (IRAs, 401(k)s). Put tax-efficient assets (like index funds) in taxable accounts. Vanguard found this alone adds 0.75% annually to after-tax returns.
- Qualified Charitable Distributions (QCDs): If you’re 70½ or older, you can donate up to $100,000 from your IRA directly to charity. It counts as your required minimum distribution (RMD) but isn’t taxed. That’s free tax planning.
- Specific share identification: Don’t let your broker use FIFO (first in, first out). Ask to sell the highest-cost shares first. That minimizes your gain. The IRS clarified this in January 2025-now you have to prove you’re using specific shares.
One investor on Reddit found $4,200 in hidden fees by switching from retail to institutional mutual fund shares. Another lost $1,800 because their advisor harvested losses but triggered wash sales across multiple accounts. The difference? One knew the rules. The other didn’t.
Rebalancing: The Discipline That Pays Off
Rebalancing isn’t about timing the market. It’s about forcing yourself to sell high and buy low-without emotion.
When stocks surge, your portfolio becomes overweight in them. When bonds drop, you’re underweight. Rebalancing means selling some stocks and buying bonds to get back to your 60/40 target. It feels counterintuitive. But it works.
According to PIMCO’s Kiran Patel, disciplined annual rebalancing improves risk-adjusted returns by 0.5% to 0.9%. Why? Because markets mean-revert. Overvalued assets tend to fall. Undervalued ones rise. Rebalancing locks in gains and buys cheap assets.
Do it manually. Don’t rely on robo-advisors. They rebalance on algorithms, not your tax situation. If you sell in a taxable account, you could trigger a big tax bill. A human advisor can time it. They can use losses to offset gains. They can wait for a dip. Robo-advisors can’t do that.
Set your rebalancing trigger at 5% deviation. If your stock allocation hits 65% (up from 60%), it’s time to rebalance. Don’t wait for 10%. That’s too late.

What to Do After Your Checkup
After your annual review, you should have:
- An updated IPS (signed and dated)
- A fee waterfall chart showing every cost
- A tax lot report showing which shares to sell
- A rebalancing action plan (what to buy, what to sell, and when)
Then, set reminders. Don’t wait until next December. Schedule a 30-minute check-in every quarter just to see if your allocation is still within 5%. No action needed unless you’re outside the band. Just monitor.
Most people think investing is about picking winners. It’s not. It’s about staying on track. The people who win aren’t the ones who time the market. They’re the ones who don’t let their portfolio drift. They’re the ones who review their IPS, cut their fees, and manage their taxes. They’re the ones who rebalance.
Common Mistakes (And How to Avoid Them)
- Mistake: Ignoring fees because “my advisor says they’re worth it.” Solution: Compare your fund expense ratios to Vanguard or Fidelity index funds. If yours are higher and underperforming, fire the fund.
- Mistake: Rebalancing in a taxable account without tax-loss harvesting. Solution: Always pair rebalancing with tax planning. Sell losers first.
- Mistake: Letting your advisor push proprietary funds. Solution: Ask: “Is this the lowest-cost option available? If not, why are we using it?”
- Mistake: Thinking “I’ll do it next year.” Solution: Mark your calendar now. Set a recurring annual event. Make it non-negotiable.
Do I need a financial advisor for an annual portfolio checkup?
No. You can do it yourself if you’re organized. You need access to your account statements, an IPS template, and a basic understanding of fees and taxes. Tools like eMoney Advisor or free platforms like Personal Capital can help consolidate your data. But if your portfolio is over $500,000 or you have complex tax situations (multiple states, trusts, business income), a fee-only fiduciary advisor is worth the cost. Just make sure they give you a fee waterfall and tax lot report.
What if I don’t have an Investment Policy Statement?
Start now. Write down your goals, risk tolerance, time horizon, and target allocation. Use a template from the CFA Institute or Vanguard’s website. Sign it. Date it. Keep it in a folder. Review it every year. An IPS doesn’t have to be fancy-it just has to be real. Without it, you’re just guessing.
How often should I rebalance my portfolio?
Annually is ideal for most people. Quarterly monitoring is smart, but full rebalancing every three months is overkill and expensive. Studies show annual reviews capture 92% of the benefits at 40% less cost than quarterly ones. Rebalance only when an asset class moves more than 5% from your target. That’s enough to correct drift without triggering unnecessary taxes or fees.
Can I use robo-advisors instead of an annual checkup?
Robo-advisors automate rebalancing and keep fees low, but they don’t do tax optimization. They can’t tell you which shares to sell to minimize gains. They can’t plan for QCDs or handle multi-state tax rules. If your portfolio is simple and under $250,000, a robo-advisor is fine. But if you care about after-tax returns, you need a human review at least once a year.
What’s the biggest mistake people make during their annual review?
They focus only on performance. “My portfolio returned 12% this year!” That’s not the point. The point is: Did you stay on track? Did you pay too much in fees? Did you create a big tax bill? A portfolio can return 15% and still be a disaster if it’s 80% stocks when you’re supposed to be 60%. Judge your success by discipline-not returns.
Annual portfolio checkups aren’t glamorous. They don’t make headlines. But they’re the quiet engine behind long-term wealth. The difference between winning and losing isn’t luck. It’s consistency. It’s showing up every year to fix what’s broken. It’s saying no to fees, yes to taxes, and always, always sticking to your plan.


OMG YES. I just did my annual checkup and found $3k in hidden fees from a fund I didn’t even know I was paying for. My advisor said it was ‘premium access’-bullshit. Swapped to VTI and my expense ratio dropped from 0.6% to 0.03%. Feels like I just got a raise. Also, tax-loss harvesting saved me $1.2k. Stop letting brokers eat your lunch.
Let me be brutally clear: if you haven’t requested a fee waterfall analysis, you are being systematically fleeced. The industry thrives on opacity. Vanguard’s data is not an outlier-it’s the baseline. Your 0.89% advisory fee? That’s $8,900 over a decade on a $100k portfolio. Meanwhile, a passive ETF portfolio with a 0.1% fee costs you $1,000. The difference isn’t performance-it’s integrity. If your advisor can’t produce a line-item breakdown of every charge, they’re not an advisor-they’re a salesperson in a suit. Demand transparency. Or leave.
It’s funny how we treat our portfolios like something we can ignore until it’s too late, isn’t it? We schedule dental checkups twice a year, we change our car’s oil religiously, but when it comes to our financial future-our retirement, our children’s education, our peace of mind-we say ‘I’ll get to it next year.’ And then we wonder why we’re stressed. The IPS isn’t just a document-it’s a promise to your future self. That promise requires discipline, not inspiration. And discipline, my dear friends, is the quiet art of showing up even when you don’t feel like it. I’ve seen people lose everything because they didn’t rebalance when stocks surged. I’ve seen others grow quietly, steadily, because they stuck to their plan. The market doesn’t reward brilliance. It rewards consistency. And consistency? It’s built one annual review at a time.
Bro, I just used Personal Capital to dump my advisor’s proprietary fund that had a 1.1% fee. Switched to SCHB. My tax lot report showed I had $7k in unrealized losses I didn’t even know about. Did tax-loss harvest + rebalanced in one afternoon. My portfolio’s now aligned with my IPS. No drama. No panic. Just math. Seriously, if you’re not doing this, you’re leaving money on the table. And no, robo-advisors won’t catch that. Only a human with a spreadsheet and a little grit will.